Scheduler
- 修正 – Microsoft が 2025 年 1 月に URL 形式を変更したため、Teams Webhook は動作を停止しました。これは現在捕捉され、URL を再作成する必要があることを説明するエラー メッセージとして表示されます。
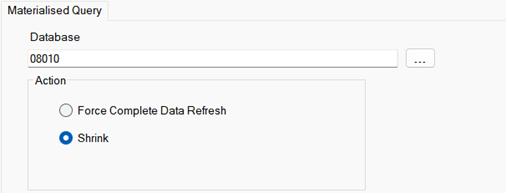
- 追加 – マテリアライズドクエリデータベースを縮小する新しいオプション。これは、データベースとログ ファイルのサイズが大きくなり、データベース サーバー上のディスク領域が不足するのを防ぐのに役立ちます。
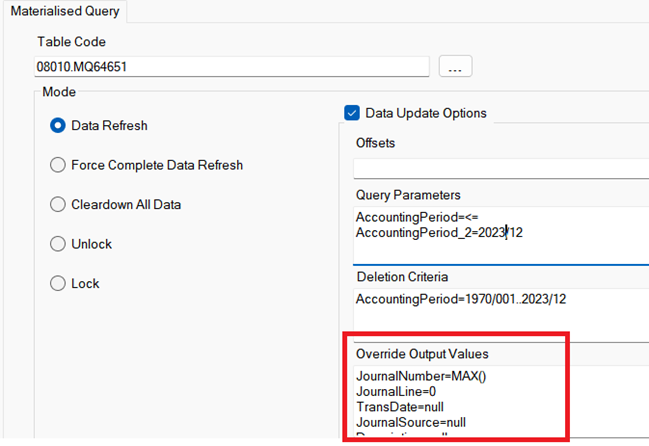
- 追加 – 新しいマテリアライズド クエリ テーブル更新オプションは、「出力値の上書き」と呼ばれます。 これは、MQ テーブルで連結期首残高トランザクションを作成するときに便利です。 たとえば、MQ テーブルには 2024 年以降の詳細元帳トランザクションを含めることができますが、過去のすべての年については連結されたトランザクションのみを含めることができます。 この場合、仕訳番号、取引日などのいくつかの出力値をオーバーライドして、レコード数を減らすことができます。 これは、レポートでは引き続き年間累計の計算を使用できますが、トランザクションへのドリルは現在の年にのみ有効であることを意味します。 これにより、履歴データの期首残高を年に 1 回更新するだけで済むため、MQ テーブルの全体的なサイズと同期時間が削減されます。
Publisher
- 修正 – 最近のビルドではレイアウトが壊れており、正しく更新されていませんでした。
- 修正 – ユーロ、ポンド、円などの通貨記号を含むスプレッドシートの数値形式が正しく表示されませんでした。
Query Builder
- 追加 – StatisticsAverage(DataPoint,MovingPoints,dataSeriesList) という式は、StatisticsGrowth() および StatisticsForecast() という既存の式を補完します。 StatisticsAverage は、一連の値を取得して移動平均または移動平均を計算します。移動平均に含めるデータ ポイントの数を指定できます。データ系列を関数に渡す方法は 3 つあります。 1 つは、カンマ区切りのリストを作成することです。 StatisticsAverage( DataRowCount(),0,”100,200,300,400,500,600″)。 2 つ目は、サブクエリとその出力名の 1 つを使用することです。 StatisticsAverage( DataRowCount(),3,”S153012.Amount”)。 最後に、データを最大 32 スロットのパラメータとして設定できます。 例えばStatisticsAverage( DataRowCount(),3,{%Jan},{%Feb},{%Mar},{%Apr},{%May},{%Jun},{%Jul},{%Aug},{%Sep},{%Oct},{%Nov},{%Dec})
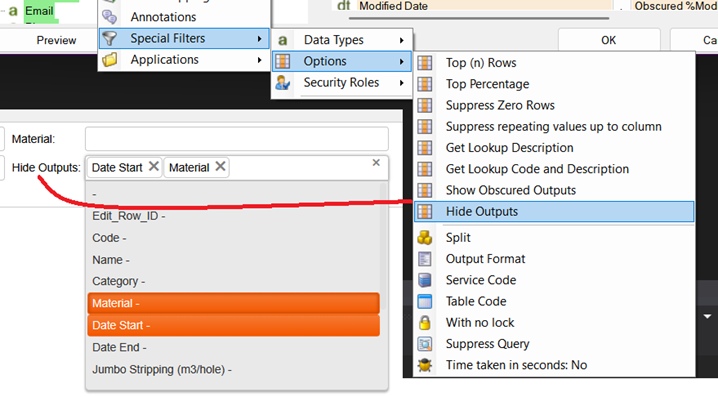
- 追加 – 出力を非表示にするフィルタ オプションを使用して、隠された出力を表示を補完します。 このオプションを使用すると、ユーザーはレポート内で非表示にする出力列を選択できます。 隠蔽された出力の表示は、このロジックの逆であり、レポートにはさまざまな隠蔽された出力列があり、ユーザーはそれらを表示することを選択でき、この方法でレポートに詳細を追加できます。
Foundry
- 追加 – フィルタ値を Web チャネル データ入力フォームにプッシュできるようにする新しい Record パラメータ。これは、会社などの高レベルのフィルターがメイン メニューにある場合に最もよく使用されます。
- 修正 – 元の開発コンピューターではないコンピューターで Foundry プロジェクトをコンパイルした場合、リソース フォルダーが正しく展開されませんでした。